The CMDebug toolbar has a number of icons to control editing and debugging. Each has a tooltip for quick reference:
| New | Create a new batch file in a new tab window. |
| Open | Open an existing batch file in a new tab window. |
| Save | Save the current batch file. |
| Print | Print the current batch file. |
| Cut | Copy the highlighted selection to the clipboard and delete it from the file. |
| Copy | Copy the highlighted selection to the clipboard. |
| Paste | Copy the contents of the clipboard to the current cursor location. |
| Delete | Delete the highlighted selection. |
| Redo | Restore the last Undo. |
| RegEx Filter | Hides all lines that don't match the regular expression, |
| Batch Arguments | New batch file arguments. The text will be parsed into %1 - %n batch arguments and used when the batch file is debugged. |
| Start Debugging | Starts the debugger. The cursor will be placed on the first line. |
| Pause Debugging | Pause execution at the next line. |
| Stop Debugging | Stops the debugger. |
| Step Into | Execute the current line. |
| Step Over | Execute the current line but disable the debugger during a CALL or GOSUB. |
| Run to Breakpoint | Execute the batch file, stopping at the next breakpoint. |
| Toggle Breakpoint | Sets or turns off a breakpoint on the current line. |
| Clear Breakpoints | Clear all breakpoints in the current batch file. |
| File Properties | Displays information on the current batch file. |
| Start New Shell | Start another copy of TCC (this is useful if you need to perform some tasks while debugging a file.) |
| Help | Display the online help. |
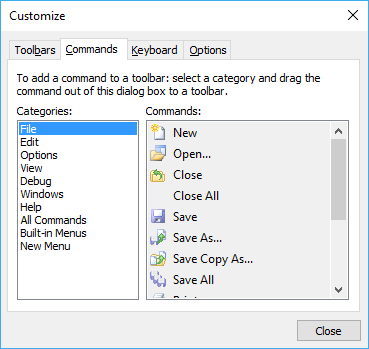
The CMDebug toolbar is customizable. To customize the toolbar click on the down arrow on the right side of the toolbar.


